

To truly do a deep dive into the numbers, it’s important to talk with the experts. Real estate pros who know how to analyze data can extrapolate useful information and predictions. We spoke with Keller Williams’ Jeff Stewart, Asheville CEO, and Zacory Ruiz, agent to get their take on recent MLS data.
Zacory has a background in startups and data. He also did some investment banking which helped him learn to look at data holistically at a macro and micro level. By doing so, he’s able to shed light on the data and put it in context of what else is going on in the world. Jeff Stewart leads the Keller Williams teams in Asheville, and has been a popular guest on Asheville Real Estate News in the past.
With COVID-19, business is changing substantially. The overall view is uncertainty, and we’re moving into an unprecedented space. There is fear, but there is also opportunity in this transition. The impact on families and incomes is the worst part. In the real estate market, it’s exciting since we’re forced into change and creating efficiencies.
Let’s Take a Deep Dive Into the Numbers
The data Zacory collected from MLS is for Buncombe county including the city of Asheville.
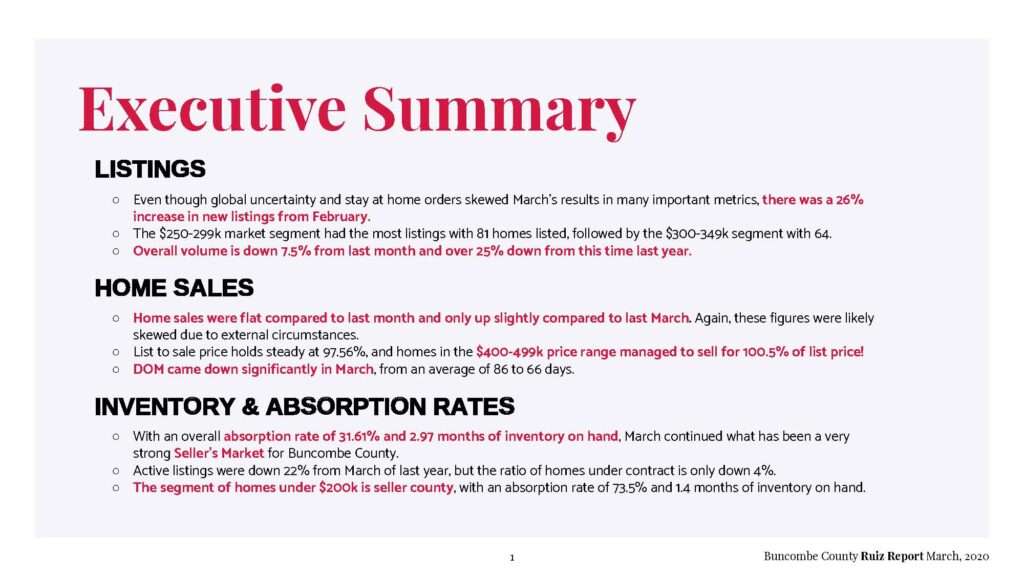
Comparing numbers to last year, March exceeded last year as well as previous months in 2020 in almost every metric. Since we started in a very strong place, even a 30% drop keeps us in safe territory.
When comparing March 2020 to February 2020, we see that new listings increased 26% to 475. The stay-at-home orders weren’t in place until the end of March. There were 968 active listings, up 2%. We may see issues with the homes under contract numbers, which went down 22% to 493, echoing consumer uncertainty. This number may not be perfectly accurate due to realtors sending info to MLS and the way they define “under contract.” The number of homes sold stayed strong, with 305 in February and 306 in March. Expired listings rose to 39, from 15% since February. Sellers withdrew homes at a higher rate – that went up 80% to 63. This is due to people who were uncertain about selling their home deciding to pull it from the market. More than the market changing, the world is changing.
This kind of month-to-month evaluation can be misleading, the experts say. Typically, we see an increase in listings from February to March. Looking ahead, the late spring/summer season will add more perspective and allow us to zoom out when looking at the numbers.
At A Glance: Activity
The number of days to close increased about 4% to 47. Days on the market reduced to 66 days, 23%, which is good. To find the absorption rate, we divide the number of homes that closed this month by the active listings. This is the rate that homes sell over a given time. We can see the absorption rate was 32%, down 21%, but it’s still a strong sellers’ market. Average sale price increased and the average list/sale held steady at 98%. Months of inventory, which indicates how long it would take to deplete the current inventory (assuming no new inventories purchased or put on the market), went up 10% to 2.97.
What does this mean? Looking at the market as a whole, like Jeff prefers, we’d like it to be balanced and healthy. We’re not seeing a lot of negotiation on price, which is an indicator of a sellers’ market. The absorption rate also helps determine the health of the market. Typically, we associate 6 months of inventory as a balanced market. We’re in a strong and safe sellers’ market. This is a positive for buyers as it gives them a little more bargaining power.
When consulting with clients, Jeff examines the months of inventory and the number of homes on the market, indicating supply & demand. Then he looks at averages and trends in different price ranges. This way, he can discuss this with the client and have strong numbers with which to recommend a course of action. For example, last year, buyers saw reduced interest rates in May. This empowered them to afford a more expensive home. This is similarly happening now, and is driving the average sale price up.
Analyzing the Data
Active listings increased over last month, as homes under contract decreased. However, the ratio of homes under contract is down only 4% from last year. Overall volume is down 7.5% from last month, but about 25% from last year. As for listings and closings, March was 291 last year, so we’re still selling as many. This is when backing up to a wide view is important and doing a deep dive into numbers all together. Our listing volume went down 11% from this time last year but up 26% from last month. March home sales were flat compared to February and slightly higher than 2019. We’re entering the typically strong time of year for the market, and the market is still very good.
The average sales price vs average list to sale price for homes shows a trend line. Basically, the price sellers are asking for is what they’re getting. Prices increased 3.5% in March compared to February, 10% since last year. In 2019, prices decreased slightly in Feb and then increased later in the year, so we’re hoping to see that happen again.
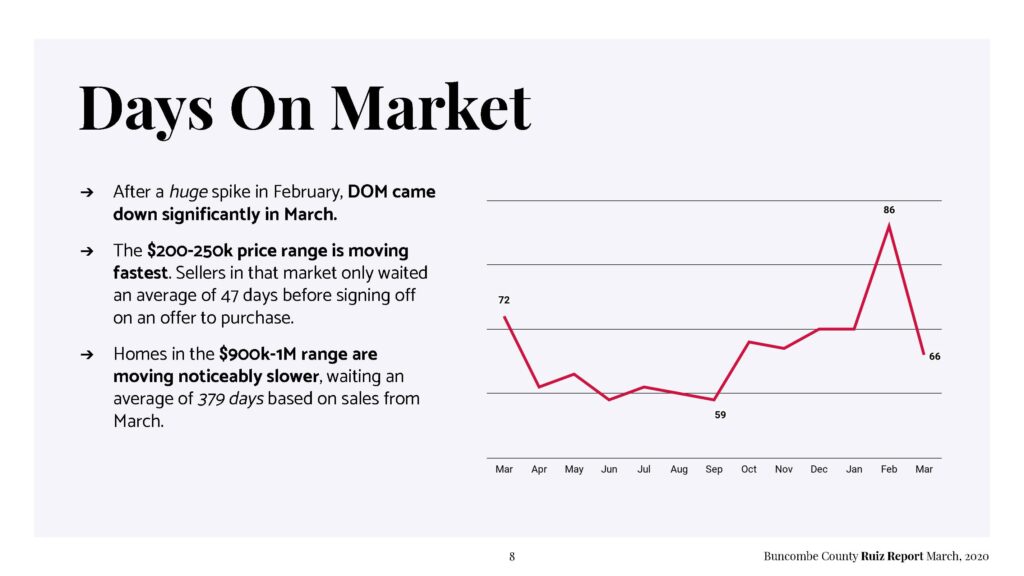
Days on the market spiked in February, then reduced in March. Homes between $200-250k moved quickly with an average 47 DOM. The DOM goes up based on price, with the $900-1m range averaging 379 DOM in March. This signals that sellers need to price homes in that range well so they sell faster. The contract-to-cash numbers indicate how long will it take from the listing date to the time there is cash in hand. In March, sellers got paid an average of 18 days faster. This is another sign of a healthy market.
Looking at these numbers helps you make informed decisions both as a seller and a buyer. Buyers have more purchasing power, and outside the city of Asheville, they qualify for more assistance and loans.
Real Estate in the Time of Coronavirus
An informed consultant realtor grounded in numbers is key during this uncertain time. They can provide insight on trends and data that another realtor may not be able to. Going with “gut feelings” and emotional decisions can often backfire financially. Historical numbers can’t predict this, so it’s important that they’re making predictions dynamically in this ever-changing time.
You need to start with an educated conversation about the numbers so you can set correct pricing. At the end of the day, this will get buyers seeing the home.
Keep moving forward. Real estate is a great way to invest, no matter what. We’ll get through this as a community, following all best practices and recommendations. We’re also leaning into tech we already have and using it to our benefit. Keep to a schedule and maintain normalcy, but be willing to pivot.
Click here to see all the slides we discussed, and stay healthy and safe.